Observing an Experiment
When you run an experiment you want to keep track of enough information,
such that you can analyse the results, and reproduce them if needed.
Sacred helps you doing that by providing an Observer Interface for your
experiments. By attaching an Observer you can gather all the information about
the run even while it is still running.
Observers have a priority attribute, and are run in order of descending
priority. The first observer determines the _id of the run, or it can be
set by the command line option --id.
At the moment there are seven observers that are shipped with Sacred:
- The main one is the Mongo Observer which stores all information in a MongoDB.
- The File Storage Observer stores the run information as files in a given directory and will therefore only work locally.
- The TinyDB Observer provides another local way of observing experiments by using tinydb to store run information in a JSON file.
- The SQL Observer connects to any SQL database and will store the relevant information there.
- The S3 Observer stores run information in an AWS S3 bucket, within a given prefix/directory
- The gcs_observer stores run information in a provided Google Cloud Storage bucket, within a given prefix/directory
- The Queue Observer can be used to wrap any of the above observers. It will put the processing of observed events on a fault-tolerant queue in a background process. This is useful for observers that rely on external services such as a database that might be temporarily unavailable.
But if you want the run information stored some other way, it is easy to write your own Custom Observer.
Mongo Observer
Note
Requires the pymongo package.
Install with pip install pymongo.
The MongoObserver is the recommended way of storing the run information from Sacred. MongoDB allows very powerful querying of the entries that can deal with almost any structure of the configuration and the custom info. Furthermore it is easy to set-up and allows to connect to a central remote DB. Most tools for further analysing the data collected by Sacred build upon this observer.
Adding a MongoObserver
You can add a MongoObserver from the command-line via the -m MY_DB flag:
>> ./my_experiment.py -m MY_DB
Here MY_DB is just the name of the database inside MongoDB that you want
the information to be stored in.
To make MongoObserver work with remote MongoDBs you have to pass a URL with a
port:
>> ./my_experiment.py -m HOST:PORT:MY_DB
>> ./my_experiment.py -m 192.168.1.1:27017:MY_DB
>> ./my_experiment.py -m my.server.org:12345:MY_DB
You can also add it from code like this:
from sacred.observers import MongoObserver

ex.observers.append(MongoObserver())
Or with server and port:
from sacred.observers import MongoObserver

ex.observers.append(MongoObserver(url='my.server.org:27017',
                                  db_name='MY_DB'))
This assumes you either have a local MongoDB running or have access to it over network without authentication. (See here on how to install)
You can setup MongoDB easily with Docker. See the instructions in Docker Setup .
Authentication
If you need authentication a little more work might be necessary.
First you have to decide which
authentication protocol
you want to use. If it can be done by just using the MongoDB URI then just pass that, e.g.:
from sacred.observers import MongoObserver

ex.observers.append(MongoObserver(
    url='mongodb://user:password@example.com/the_database?authMechanism=SCRAM-SHA-1',
    db_name='MY_DB'))
If additional arguments need to be passed to the MongoClient they can just be included:
ex.observers.append(MongoObserver(
    url="mongodb://<X.509 derived username>@example.com/?authMechanism=MONGODB-X509",
    db_name='MY_DB',
    ssl=True,
    ssl_certfile='/path/to/client.pem',
    ssl_cert_reqs=ssl.CERT_REQUIRED,
    ssl_ca_certs='/path/to/ca.pem'))
Database Entry
The MongoObserver creates three collections to store information. The first,
runs (that name can be changed), is the main collection that contains one
entry for each run.
The other two (fs.files, fs.chunks) are used to store associated files
in the database (compare GridFS).
Note
This is the new database layout introduced in version 0.7.0. Before that there was a common prefix default for all collections.
So here is an example entry in the runs collection:
> db.runs.find()[0]
{
    "_id" : ObjectId("5507248a1239672ae04591e2"),
    "format" : "MongoObserver-0.7.0",
    "status" : "COMPLETED",
    "result" : null,
    "start_time" : ISODate("2016-07-11T14:50:14.473Z"),
    "heartbeat" : ISODate("2015-03-16T19:44:26.530Z"),
    "stop_time" : ISODate("2015-03-16T19:44:26.532Z"),
    "config" : {
        "message" : "Hello world!",
        "seed" : 909032414,
        "recipient" : "world"
    },
    "info" : { },
    "resources" : [ ],
    "artifacts" : [ ],
    "captured_out" : "Hello world!\n",
    "experiment" : {
        "name" : "hello_cs",
        "base_dir" : "$(HOME)/sacred/examples/"
        "dependencies" : ["numpy==1.9.1", "sacred==0.7.0"],
        "sources" : [
            [
                "03_hello_config_scope.py",
                ObjectId("5507248a1239672ae04591e3")
            ]
        ],
        "repositories" : [{
            "url" : "git@github.com:IDSIA/sacred.git"
                            "dirty" : false,
                            "commit" : "d88deb2555bb311eb779f81f22fe16dd3b703527"}]
    },
    "host" : {
        "os" : ["Linux",
                "Linux-3.13.0-46-generic-x86_64-with-Ubuntu-14.04-trusty"],
        "cpu" : "Intel(R) Core(TM) i7-3770 CPU @ 3.40GHz",
        "hostname" : "MyAwesomeMachine",
        "python_version" : "3.4.0"
    },
}
As you can see a lot of relevant information is being stored, among it the used configuration, automatically detected package dependencies and information about the host.
If we take a look at the fs.files collection we can also see, that
it stored the sourcecode of the experiment in the database:
> db.fs.files.find()[0]
{
    "_id" : ObjectId("5507248a1239672ae04591e3"),
    "filename" : "$(HOME)/sacred/examples/03_hello_config_scope.py",
    "md5" : "897b2144880e2ee8e34775929943f496",
    "chunkSize" : 261120,
    "length" : 1526,
    "uploadDate" : ISODate("2016-07-11T12:50:14.522Z")
}
File Storage Observer
The FileStorageObserver is the most basic observer and requires the least amount of setup. It is mostly meant for preliminary experiments and cases when setting up a database is difficult or impossible. But in combination with the template rendering integration it can be very helpful.
Adding a FileStorageObserver
The FileStorageObserver can be added from the command-line via the
-F BASEDIR and --file_storage=BASEDIR flags:
>> ./my_experiment.py -F BASEDIR
>> ./my_experiment.py --file_storage=BASEDIR
Here BASEDIR is the name of the directory in which all the subdirectories
for individual runs will be created.
You can, of course, also add it from code like this:
from sacred.observers import FileStorageObserver

ex.observers.append(FileStorageObserver('my_runs'))
Directory Structure
The FileStorageObserver creates a separate sub-directory for each run and stores several files in there:
my_runs/
    run_3mdq4amp/
        config.json
        cout.txt
        info.json
        run.json
    run_zw82a7xg/
        ...
    ...
config.json contains the JSON-serialized version of the configuration
and cout.txt the captured output.
The main information is stored in run.json and is very similar to the
database entries from the Mongo Observer:
{
  "command": "main",
  "status": "COMPLETED",
  "start_time": "2016-07-11T15:35:14.765152",
  "heartbeat": "2016-07-11T15:35:14.766793",
  "stop_time": "2016-07-11T15:35:14.768465",
  "result": null,
  "experiment": {
    "base_dir": "/home/greff/Programming/sacred/examples",
    "dependencies": [
      "numpy==1.11.0",
      "sacred==0.6.9"],
    "name": "hello_cs",
    "repositories": [{
        "commit": "d88deb2555bb311eb779f81f22fe16dd3b703527",
        "dirty": false,
        "url": "git@github.com:IDSIA/sacred.git"}],
    "sources": [
      ["03_hello_config_scope.py",
       "_sources/03_hello_config_scope_897b2144880e2ee8e34775929943f496.py"]]
  },
  "host": {
    "cpu": "Intel(R) Core(TM) i7-3770 CPU @ 3.40GHz",
    "hostname": "Liz",
    "os": ["Linux",
           "Linux-3.19.0-58-generic-x86_64-with-Ubuntu-15.04-vivid"],
    "python_version": "3.4.3"
  },
  "artifacts": [],
  "resources": [],
  "meta": {},
}
In addition to that there is an info.json file holding Saving Custom Information
(if existing) and all the Artifacts.
The FileStorageObserver also stores a snapshot of the source-code in a separate
my_runs/_sources directory, and Resources in my_runs/_resources
(if present).
Their filenames are stored in the run.json file such that the corresponding
files can be easily linked to their respective run.
Storing source-code in this way can be disabled by passing
copy_sources=False when creating the FileStorageObserver. Copying any
Resources that are already present in my_runs/, but not present in
my_runs/_resources/ (for example, a resource that is the output of another
run), can be disabled my passing copy_artifacts=False when creating the
FileStorageObserver.
Template Rendering
In addition to these basic files, the FileStorageObserver can also generate a
report for each run from a given template file.
The prerequisite for this is that the mako package is installed and a
my_runs/template.html file needs to exist.
The file can be located somewhere else, but then the filename must be passed to
the FileStorageObserver like this:
from sacred.observers import FileStorageObserver

ex.observers.append(FileStorageObserver('my_runs', template='/custom/template.txt'))
The FileStorageObserver will then render that template into a
report.html/report.txt file in the respective run directory.
mako is a very powerful templating engine that can execute
arbitrary python-code, so be careful about the templates you use.
For an example see sacred/examples/my_runs/template.html.
TinyDB Observer
Note
requires the tinydb, tinydb-serialization, and hashfs packages installed.
The TinyDbObserver uses the tinydb library to provides an alternative to storing results in MongoDB whilst still allowing results to be stored in a document like database. This observer uses TinyDB to store the metadata about an observed run in a JSON file.
The TinyDbObserver also makes use of the hashfs hashfs library to store artifacts, resources and source code files associated with a run. Storing results like this provides an easy way to lookup associated files for a run bases on their hash, and ensures no duplicate files are stored.
The main drawback of storing files in this way is that they are not easy to manually inspect, as their path names are now the hash of their content. Therefore, to aid in retrieving data and files stored by the TinyDbObserver, a TinyDbReader class is provided to allow for easier querying and retrieval of the results. This ability to store metadata and files in a way that can be queried locally is the main advantage of the TinyDbObserver observer compared to the FileStorageObserver.
The TinyDbObserver is designed to be a simple, scalable way to store and query results as a single user on a local file system, either for personal experimentation or when setting up a larger database configuration is not desirable.
Adding a TinyDbObserver
The TinyDbObserver can be added from the command-line via the
-t BASEDIR and --tiny_db=BASEDIR flags:
>> ./my_experiment.py -t BASEDIR
>> ./my_experiment.py --tiny_db=BASEDIR
Here BASEDIR specifies the directory in which the TinyDB JSON file and
hashfs filesytem will be created. All intermediate directories are created with
the default being to create a directory called runs_db in the current
directory.
Alternatively, you can also add the observer from code like this:
from sacred.observers import TinyDbObserver

ex.observers.append(TinyDbObserver('my_runs'))

# You can also create this observer from a HashFS and
# TinyDB object directly with:
ex.observers.append(TinyDbObserver.create_from(my_db, my_fs))
Directory Structure
The TinyDbObserver creates a directory structure as follows:
my_runs/
    metadata.json
    hashfs/
metadata.json contains the JSON-serialized metadata in the TinyDB format.
Each entry is very similar to the database entries from the Mongo Observer:
{
  "_id": "2118c70ef274497f90b7eb72dcf34598",
  "artifacts": [],
  "captured_out": "",
  "command": "run",
  "config": {
    "C": 1,
    "gamma": 0.7,
    "seed": 191164913
  },
  "experiment": {
    "base_dir": "/Users/chris/Dropbox/projects/dev/sacred-tinydb",
    "dependencies": [
      "IPython==5.1.0",
      "numpy==1.11.2",
      "sacred==0.7b0",
      "sklearn==0.18"
    ],
    "name": "iris_rbf_svm",
    "repositories": [],
    "sources": [
      [
        "test_exp.py",
        "6f4294124f7697655f9fd1f7d4e7798b",
        "{TinyFile}:\"6f4294124f7697655f9fd1f7d4e7798b\""
      ]
    ]
  },
  "format": "TinyDbObserver-0.7b0",
  "heartbeat": "{TinyDate}:2016-11-12T01:18:00.228352",
  "host": {
    "cpu": "Intel(R) Core(TM)2 Duo CPU     P8600  @ 2.40GHz",
    "hostname": "phoebe",
    "os": [
      "Darwin",
      "Darwin-15.5.0-x86_64-i386-64bit"
    ],
    "python_version": "3.5.2"
  },
  "info": {},
  "meta": {},
  "resources": [],
  "result": 0.9833333333333333,
  "start_time": "{TinyDate}:2016-11-12T01:18:00.197311",
  "status": "COMPLETED",
  "stop_time": "{TinyDate}:2016-11-12T01:18:00.337519"
}
The elements in the above example are taken from a generated JSON file, where
those prefixed with {TinyData} will be converted into python datetime
objects upon reading them back in. Likewise those prefixed with {TinyFile}
will be converted into a file object opened in read mode for the associated
source, artifact or resource file.
The files referenced in either the sources, artifacts or resources sections
are stored in a location according to the hash of their contents under the
hashfs/ directory. The hashed file system is setup to create three
directories from the first 6 characters of the hash, with the rest of
the hash making up the file name. The stored source file is therefore
located at
my_runs/
    metadata.json
    hashfs/
        59/
            ab/
                16/
                    5b3579a1869399b4838be2a125
A file handle, serialised with the tag {TinyFile} in the JSON file, is
included in the metadata alongside individual source files, artifacts or
resources as a convenient way to access the file content.
The TinyDB Reader
To make querying and stored results easier, a TinyDbReader class is provided. Create a class instance by passing the path to the root directory of the TinyDbObserver.
from sacred.observers import TinyDbReader

reader = TinyDbReader('my_runs')
The TinyDbReader class provides three main methods for retrieving data:
.fetch_metadata()will return all metadata associated with an experiment..fetch_files()will return a dictionary of file handles for the sources, artifacts and resources..fetch_report()will will return all metadata rendered in a summary report.
All three provide a similar API, allowing the search for records by index, by experiment name, or by using a TinyDB search query. To do so specify one of the following arguments to the above methods:
indicesaccepts either a single integer or a list of integers and works like list indexing, retrieving experiments in the order they were run. e.g.indices=0will get the first or oldest experiment, andindices=-1will get the latest experiment to run.exp_nameaccepts a string and retrieves any experiment that contains that string in its name. Also works with regular expressions.queryaccepts a TinyDB query object and returns all experiments that match it. Refer to the TinyDB documentation for details on the API.
Retrieving Files
To get the files from the last experimental run:
results = reader.fetch_files(indices=-1)
The results object is a list of dictionaries, each containing the date the experiment started, the experiment id, the experiment name, as well as nested dictionaries for the sources, artifacts and resources if they are present for the experiment. For each of these nested dictionaries, the key is the file name, and the value is a file handle opened for reading that file.
[{'date': datetime.datetime(2016, 11, 12, 1, 36, 54, 970229),
  'exp_id': '68b71b5c009e4f6a887479cdda7a93a0',
  'exp_name': 'iris_rbf_svm',
  'sources': {'test_exp.py': <BufferedReaderWrapper name='...'>}}]
Individual files can therefore be accessed with,
results = reader.fetch_files(indices=-1)
f = results[0]['sources']['test_exp.py']
f.read()
Depending on whether the file contents is text or binary data, it can then either be printed to console or visualised in an appropriate library e.g. Pillow for images. The content can also be written back out to disk and inspected in an external program.
Summary Report
Often you may want to see a high level summary of an experimental run,
such as the config used the results, and any inputs, dependencies and other artifacts
generated. The .fetch_report() method is designed to provide these rendered as a
simple text based report.
To get the report for the last experiment simple run,
results = reader.fetch_report(indices=-1)
print(results[0])
-------------------------------------------------
Experiment: iris_rbf_svm
-------------------------------------------------
ID: 68b71b5c009e4f6a887479cdda7a93a0
Date: Sat 12 Nov 2016    Duration: 0:0:0.1

Parameters:
    C: 1.0
    gamma: 0.7
    seed: 816200523

Result:
    0.9666666666666667

Dependencies:
    IPython==5.1.0
    numpy==1.11.2
    sacred==0.7b0
    sacred.observers.tinydb_hashfs==0.7b0
    sklearn==0.18

Resources:
    None

Source Files:
    test_exp.py

Outputs:
    None
SQL Observer
The SqlObserver saves all the relevant information in a set of SQL tables. It requires the sqlalchemy package to be installed.
Adding a SqlObserver
The SqlObserver can be added from the command-line via the
-s DB_URL and --sql=DB_URL flags:
>> ./my_experiment.py -s DB_URL
>> ./my_experiment.py --sql=DB_URL
Here DB_URL is a url specifying the dialect and server of the SQL database
to connect to. For example:
- PostgreSQL:
postgresql://scott:tiger@localhost/mydatabase- MySQL:
mysql://scott:tiger@localhost/foo- SqlLite:
sqlite:///foo.db
For more information on the database-urls see the sqlalchemy documentation.
To add a SqlObserver from python code do:
from sacred.observers import SqlObserver

ex.observers.append(SqlObserver('sqlite:///foo.db'))

# It's also possible to instantiate a SqlObserver with an existing
# engine and session with:
ex.observers.append(SqlObserver.create_from(my_engine, my_session))
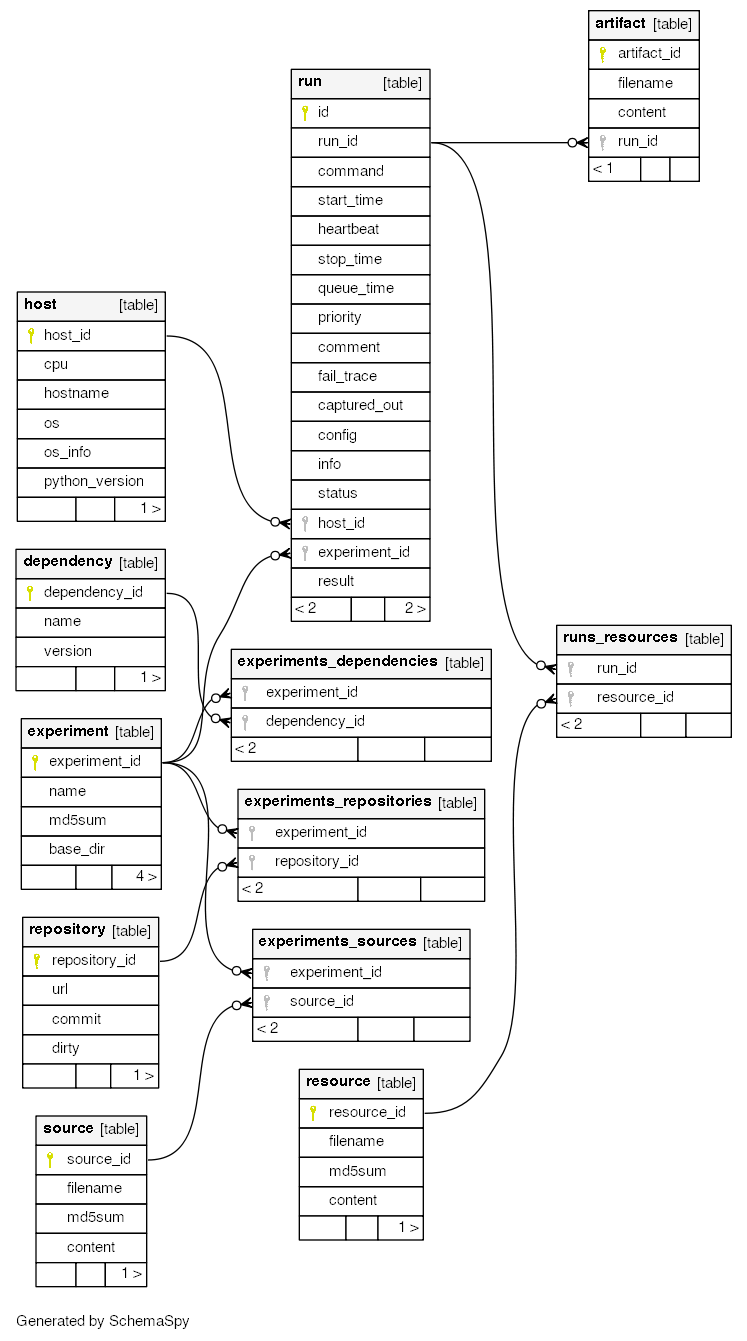
Schema
S3 Observer
The S3Observer stores run information in a designated prefix location within a S3 bucket, either by
using an existing bucket, or creating a new one. Using the S3Observer requires that boto3 be
installed, and also that an AWS config file is created with a user’s Access Key and Secret Key.
An easy way to do this is by installing AWS command line tools (pip install awscli) and
running aws configure.
Adding a S3Observer
To create an S3Observer in Python:
from sacred.observers import S3Observer
ex.observers.append(S3Observer(bucket='my-awesome-bucket',
                               basedir='/my-project/my-cool-experiment/'))
By default, an S3Observer will use the region that is set in your AWS config file, but if you’d
prefer to pass in a specific region, you can use the region parameter of create to do so.
If you try to create an S3Observer without this parameter, and with region not set in your config
file, it will error out at the point of the observer object being created.
Directory Structure
S3Observers follow the same conventions as FileStorageObservers when it comes to directory
structure within a S3 bucket: within s3://<bucket>/basedir/ numeric run directories will be
created in ascending order, and each run directory will contain the files specified within the
FileStorageObserver Directory Structure documentation above.
Google Cloud Storage Observer
Note
Requires the google cloud storage package.
Install with pip install google-cloud-storage.
The Google Cloud Storage Observer allows for experiments to be logged into cloud storage buckets provided by Google. In order to use this observer, the user must have created a bucket on the service prior to the running an experiment using this observer.
Adding a GoogleCloudStorageObserver
To create an GoogleCloudStorageObserver in Python:
from sacred.observers import GoogleCloudStorageObserver
ex.observers.append(GoogleCloudStorageObserver(bucket='bucket-name',
                                               basedir='/experiment-name/'))
In order for the observer to correctly connect to the provided bucket, The environment variable `` GOOGLE_APPLICATION_CREDENTIALS`` needs to be set by the user. This variable should point to a valid JSON file containing Google authorisation credentials (see: Google Cloud authentication).
Directory Structure
GoogleCloudStorageObserver follow the same conventions as FileStorageObservers when it comes to directory
structure within a bucket: within gs://<bucket>/basedir/ numeric run directories will be
created in ascending order, and each run directory will contain the files specified within the
FileStorageObserver Directory Structure documentation above.
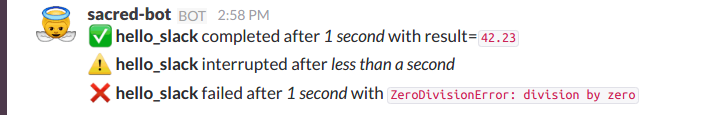
Slack Observer
The SlackObserver sends a message to
Slack using an
incoming webhook everytime an
experiment stops:
It requires the requests package to be
installed and the webhook_url of the incoming webhook configured in Slack.
This url is something you shouldn’t share with others, so the recommended way
of adding a SlackObserver is from a configuration file:
from sacred.observers import SlackObserver

slack_obs = SlackObserver.from_config('slack.json')
ex.observers.append(slack_obs)

# You can also instantiate it directly without a config file:
 slack_obs = SlackObserver(my_webhook_url)
Where slack.json at least specifies the webhook_url:
# Content of file 'slack.json':
{
    "webhook_url": "https://hooks.slack.com/services/T00000000/B00000000/XXXXXXXXXXXXXXXXXXXXXXXX"
}
But it can optionally also customize the other attributes:
# Content of file 'slack.json':
{
    "webhook_url": "https://hooks.slack.com/services/T00000000/B00000000/XXXXXXXXXXXXXXXXXXXXXXXX",
    "icon": ":imp:",
    "bot_name": "my-sacred-bot",
    "completed_text": "YAY! {ex_info[name] completed with result=`{result}`",
    "interrupted_text": null,
    "failed_text": "Oh noes! {ex_info[name] failed saying `{error}`"
}
Telegram Observer
The TelegramObserver sends status updates to
Telegram using their
Python Telegram Bot API which
obviously has to be installed to use this observer.
pip install --upgrade python-telegram-bot
Before using this observer, three steps need to be taken:
- Create the bot with @BotFather <https://core.telegram.org/bots#6-botfather>
- Write to the newly-created bot, since only users can initiate conversations with telegram bots.
- Retrieve the
chat_idfor the chat the bot will send updates to.
The last step can be accomplished using the following script:
import  telegram

TOKEN = 'token obtained from @BotFather'

bot = telegram.Bot(TOKEN)
for u in bot.get_updates():
    print('{}: [{}] {}'.format(u.message.date, u.message.chat_id, u.message.text))
As with the SlackObserver, the
TelegramObserver needs to be provided with a json, yaml
or pickle file containing…
token: the HTTP API token acquired whilechat_id: the ID (not username) of the chat to write the updates to. This can be a user or a group chat ID- optionally: a boolean for
silent_completion. If set to true, regular experiment completions will use no or less intrusive notifications, depending on the receiving device’s platform. Experiment starts will always be sent silently, interruptions and failures always with full notifications.- optionally: a string for
proxy_url. Specify this field, if Telegram is blocked in the local network or in the country, and you want to use proxy server. Format:PROTOCOL://PROXY_HOST:[PROXY_PORT]/. Socks5 and HTTP protocols are supported. These settings also could be received fromHTTPS_PROXYorhttps_proxyenvironment variable.- optionally:
usernamefor proxy.- optionally:
passwordfor proxy.
The observer is then added to the experiment like this:
from sacred.observers import TelegramObserver

telegram_obs = TelegramObserver.from_config('telegram.json')
ex.observers.append(telegram_obs)
To set the bot’s profile photo and description, use @BotFather’s commands /setuserpic and /setdescription.
Note that /setuserpic requires a minimum picture size.
Neptune Observer
Neptune observer sends all the experiment metadata to the Neptune UI. It requires the neptune-sacred package to be installed. You can install it by running:
pip install neptune-client neptune-sacred
Adding a Neptune Observer
NeptuneObserver can only be added from the Python code. You simply need to initialize it with your project name and (optionally) api token.
from neptune.new.integrations.sacred import NeptuneObserver
ex.observers.append(NeptuneObserver(api_token='<YOUR_API_TOKEN>',
                                    project='<YOUR_WORKSPACE/YOUR_PROJECT>'))
Warning
Always keep your API token secret - it is like password to the application. It is recommended to pass your token via the environment variable NEPTUNE_API_TOKEN. To make things simple you can put export NEPTUNE_API_TOKEN=YOUR_LONG_API_TOKEN line to your ~/.bashrc or ~/.bash_profile files.
Queue Observer
The QueueObserver can be used on top of other existing observers. It runs in a background thread. Observed events are buffered in a queue and the background thread is woken up to process new events at a fixed interval of 20 seconds be default. If the processing of an event fails, the event is put back on the queue and processed next time. This is useful for observers that rely on external services like databases that might become temporarily unavailable. Normally, the experiment would fail at this point, which could result in long running experiments being unnecessarily aborted. The QueueObserver can tolerate such temporary problems.
However, the QueueObserver has currently no way of declaring an event as finally failed, so if the failure is not due to a temporary unavailability of an external service, the observer will try forever.
Adding a Queue Observer
The QueueObserver can be used to wrap any other instantiated observer.
For example, the FileStorageObserver can be made to use a queue like so
from sacred.observers import FileStorageObserver, QueueObserver

fs_observer = FileStorageObserver('my_runs', template='/custom/template.txt')
ex.observers.append(QueueObserver(fs_observer)
For wrapping the Mongo Observer a convenience class is provided to instantiate the queue based version.
from sacred.observers import QueuedMongoObserver

ex.observers.append(
    QueuedMongoObserver(url="my.server.org:27017", db_name="MY_DB")
)
Events
A started_event is fired when a run starts.
Then every 10 seconds while the experiment is running a heatbeat_event is
fired.
Whenever a resource or artifact is added to the running experiment a
resource_event resp. artifact_event is fired.
Finally, once it stops one of the three completed_event,
interrupted_event, or failed_event is fired.
If the run is only being queued, then instead of all the above only a single
queued_event is fired.
Start
The moment an experiment is started, the first event is fired for all the observers. It contains the following information:
ex_info Some information about the experiment:
- the docstring of the experiment-file
- filename and md5 hash for all source-dependencies of the experiment
- names and versions of packages the experiment depends on
command The name of the command that was run. host_info Some information about the machine it’s being run on:
- CPU name
- number of CPUs
- hostname
- Operating System
- Python version
- Python compiler
start_time The date/time it was started config The configuration for this run, including the root-seed. meta_info Meta-information about this run such as a custom comment and the priority of this run. _id The ID of this run, as determined by the first observer
The started event is also the time when the ID of the run is determined. Essentially the first observer which sees _id=None sets an id and returns it. That id is then stored in the run and also passed to all further observers.
Queued
If a run is only queued instead of being run (see Queue), then this event is fired instead
of a started_event. It contains the same information as the
started_event except for the host_info.
Heartbeat
While the experiment is running, every 10 seconds a Heartbeat event is fired.
It updates the captured stdout and stderr of the experiment, the custom
info (see below), and the current result. The heartbeat event is also a
way of monitoring if an experiment is still running.
Stop
Sacred distinguishes three ways in which an experiment can end:
- Successful Completion:
- If an experiment finishes without an error, a
completed_eventis fired, which contains the time it completed and the result the command returned. - Interrupted:
- If a
KeyboardInterruptexception occurs (most of time this means you cancelled the experiment manually) instead aninterrupted_eventis fired, which only contains the interrupt time. - Failed:
- In case any other exception occurs, Sacred fires a
failed_eventwith the fail time and the corresponding stacktrace.
Resources
Every time sacred.Experiment.open_resource() is called with a
filename, an event will be fired with that filename (see Resources).
Artifacts
Every time sacred.Experiment.add_artifact() is called with a filename
and optionally a name, an event will be fired with that name and filename
(see Artifacts). If the name is left empty it defaults to the filename.
Saving Custom Information
Sometimes you want to add custom information about the run of an experiment, like the dataset, error curves during training, or the final trained model. To allow this sacred offers three different mechanisms.
Info Dict
The info dictionary is meant to store small amounts of information about
the experiment, like training loss for each epoch or the total number of
parameters. It is updated on each heartbeat, such that its content is
accessible in the database already during runtime.
To store information in the info dict it can be accessed via ex.info,
but only while the experiment is running.
Another way is to access it directly through the run with _run.info.
This can be done conveniently using the special _run parameter in any
captured function, which gives you access to the current Run object.
You can add whatever information you like to _run.info. This info dict
will be sent to all the observers every 10 sec as part of the
heartbeat_event.
Warning
Many observers will convert the information of info into JSON using the
jsonpickle library. This works for most python datatypes, but the resulting
entries in the database may look different from what you might expect.
So only store non-JSON information if you absolutely need to.
If the info dict contains numpy arrays or pandas Series/DataFrame/Panel
then these will be converted to json automatically. The result is human
readable (nested lists for numpy and a dict for pandas), but might be
imprecise in some cases.
Resources
Generally speaking a resource is a file that your experiment needs to read
during a run. When you open a file using ex.open_resource(filename) then
a resource_event will be fired and the MongoObserver will check whether
that file is in the database already. If not it will store it there.
In any case the filename along with its MD5 hash is logged.
Artifacts
An artifact is a file created during the run. This mechanism is meant to store
big custom chunks of data like a trained model. With
sacred.Experiment.add_artifact() such a file can be added, which will fire an
artifact_event. The MongoObserver will then in turn again, store that file
in the database and log it in the run entry.
Artifacts always have a name, but if the optional name parameter is left empty
it defaults to the filename.
Custom Observer
The easiest way to implement a custom observer is to inherit from
sacred.observers.RunObserver and override some or all of the events:
from sacred.observer import RunObserver

class MyObserver(RunObserver):
    def queued_event(self, ex_info, command, queue_time, config, meta_info,
                     _id):
        pass

    def started_event(self, ex_info, command, host_info, start_time,
                      config, meta_info, _id):
        pass

    def heartbeat_event(self, info, captured_out, beat_time, result):
        pass

    def completed_event(self, stop_time, result):
        pass

    def interrupted_event(self, interrupt_time, status):
        pass

    def failed_event(self, fail_time, fail_trace):
        pass

    def resource_event(self, filename):
        pass

    def artifact_event(self, name, filename):
        pass